| 일 | 월 | 화 | 수 | 목 | 금 | 토 |
|---|---|---|---|---|---|---|
| 1 | ||||||
| 2 | 3 | 4 | 5 | 6 | 7 | 8 |
| 9 | 10 | 11 | 12 | 13 | 14 | 15 |
| 16 | 17 | 18 | 19 | 20 | 21 | 22 |
| 23 | 24 | 25 | 26 | 27 | 28 | 29 |
| 30 |
- 데이터베이스
- Django
- numpy
- tensorflow
- FLASK
- 텐서플로우
- GUI
- Computer Vision
- k8s
- Tkinter
- 그래픽 유저 인터페이스
- yaml
- 파이토치
- MariaDB
- vue.js
- 논문 리뷰
- POD
- 딥러닝
- pytorch
- Web Programming
- 웹 프로그래밍
- OpenCV
- kubernetes
- 파이썬
- 장고
- Deep Learning
- Python
- 컴퓨터 비전
- Docker
- paper review
- Today
- Total
Maxima's Lab
[Python, Opencv] Kmeans Clustering (Image Segmentation) & 3-D Scatter Plot 본문
[Python, Opencv] Kmeans Clustering (Image Segmentation) & 3-D Scatter Plot
Minima 2022. 6. 2. 23:48Kmeans Clustering
오늘은 Kmeans Clustering 알고리즘을 통해 Imgae Segmentation을 해보고 해당 결과를 통해 3-D Scatter Plot 까지 진행 해보도록 하겠습니다.
※opencv의 cv2.kmeans() 함수 사용
- 이미지 불러오기
import cv2
import matplotlib.pyplot as plt

img_path = "..."
img = cv2.imread(img_path)

# cv2.imshow("Original Image", img)
# cv2.waitKey(0)
# cv2.destroyAllWindows()

plt.figure("Original Image")
plt.axis("off")
plt.imshow(cv2.cvtColor(img, cv2.COLOR_BGR2RGB))
plt.show()

※ cv2.imread() 사용 시 B(Blue), G(Green), R(Red) 순으로 불러오며, cv2.imshow() 사용 시 다시 R(Red), G(Green), B(Blue) 순으로 이미지를 시각화 합니다. (단, plt.imshow() 사용 시 cv2.cvtColor()를 통해 BGR --> RGB로 변환 후 사용하시는 것을 추천 드립니다.)
- Kmeans Clustering 적용
criteria = (cv2.TERM_CRITERIA_EPS + cv2.TERM_CRITERIA_MAX_ITER, 10, 1.0)
vectorized_img = img.reshape((-1,3)).astype("float32")
print(vectorized_img)
K = 3
attempts = 10
height, width = img.shape[0], img.shape[1]

_, label_img, center_img = cv2.kmeans(vectorized_img, K, None, criteria, attempts, cv2.KMEANS_RANDOM_CENTERS)

label_img = label_img.reshape(height, width).astype("uint8")

plt.figure("Label Image")
plt.axis("off")
plt.imshow(label_img)
plt.show()

cv2.kmeans() 사용을 통해 얻은 결과 중 label_img를 Original Image의 height, width 값에 맞게 Reshape 과정을 거치면 위의 Label Image를 얻을 수 있습니다. (단, Label Image의 각 pixel의 값은 0, 1, 2 중 하나의 값을 가지게 됩니다.)
※ K = 4인 경우에는 0, 1, 2, 3 중 하나의 값을 가질 수 있습니다.
from mpl_toolkits.mplot3d import Axes3D
import numpy as np
import random


fig = plt.figure(figsize=(10, 10))

ax = fig.add_subplot(111, projection='3d')

ax.set_title("Kmeans Clustering", size=20)

# Set axes corresponding to each channel
ax.set_xlabel("Blue", size=15)
ax.set_ylabel("Green", size=15)
ax.set_zlabel("Red", size=15)

x = img[:,:,0].flatten()
y = img[:,:,1].flatten()
z = img[:,:,2].flatten()
label = label_img.flatten()

# Random Sample
index_list = [i for i in range(len(x))]
sample_list = random.sample(index_list, 500)


for index in sample_list:
  if label[index] == 0:
    ax.scatter([x[index]], [y[index]], [z[index]], color = "black")

  elif label[index] == 1:
    ax.scatter([x[index]], [y[index]], [z[index]], color = "green")

  else:
    ax.scatter([x[index]], [y[index]], [z[index]], color = "purple")

ax.scatter(center_img[:, [0]], center_img[:, [1]], center_img[:, [2]], color = "red", s = 200)

plt.show()
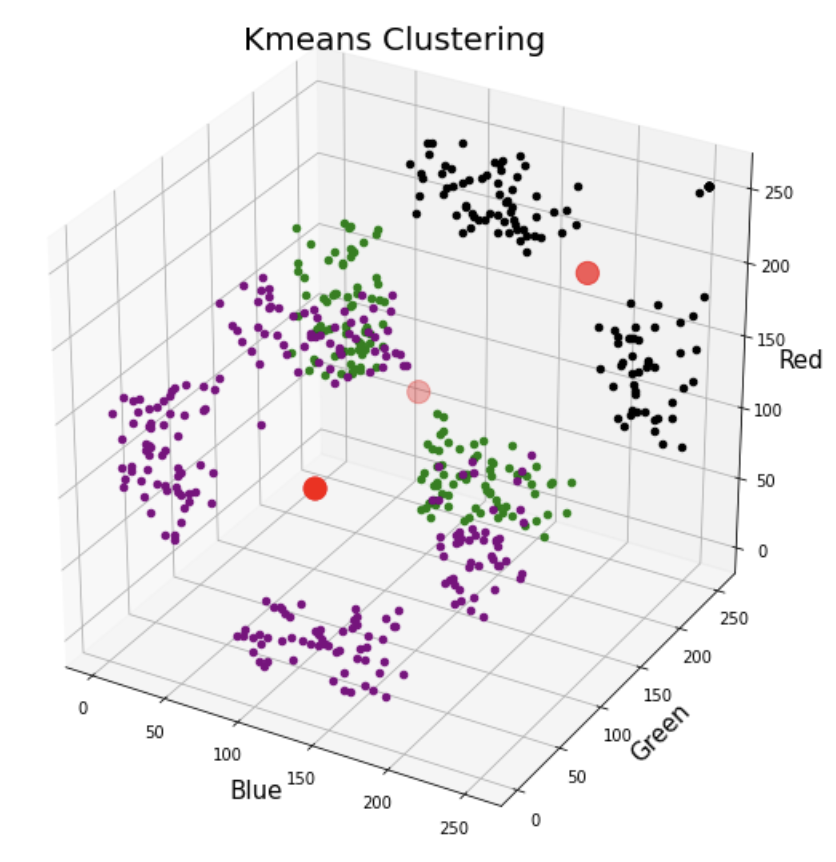
Kmeans Clustering을 통해 얻은 Label Image와 Original Image를 사용해서 총 3개의 Clusters를 중심으로 Pixel 값들이 어떻게 이루어져 있는 지 시각화 작업을 진행합니다. 먼저 각 Channel(Blue, Green, Red)를 구분하여 3개의 축으로 설정하고 512 * 512 = 262,144개의 pixel들 중 Random Sample 작업을 진행 후 어떤 Cluster에 속하는 지에 따라 "black", "green", "purple" 색을 통해 scatter plot을 진행하며, Cluster의 중심은 "red" 색을 통해 시각화 작업을 진행하였습니다.
※ Random Sample 개수, scatter의 color 등 편의에 따라 다르게 설정해주시면 됩니다.

Kmeans Clustering 알고리즘을 통해 Image Segmentation 및 3-D Scatter Plot 하는 방법에 대해서 알아보았습니다.
추가적인 이미지 및 K 값의 변화에 따른 결과도 확인해보시기 바랍니다.
'Python > Opencv' 카테고리의 다른 글
| [Python, Opencv] Binary Objects을 포함하는 가장 작은 사각형 찾기 (0) | 2024.03.16 |
|---|---|
| [Python, Opencv] Mouse Event (마우스 이벤트) (0) | 2022.07.06 |
| [Python, Opencv] Edge Detection (엣지 검출) - Sobel Filter (소벨 필터) (1) | 2022.06.29 |
| [Python, Opencv] Template matching (템플릿 매칭) (0) | 2022.06.14 |


